AMT asks Assistant Professor Aaron Hill all about Data Vis and its place in his practice, and in art and design practice in general.
How did you first get interested in data visualization?
I come to the practice of data visualization from the tradition of statistical and analytical graphs. My background is in statistics and research, a field that I chose because it offers a strong framework for understanding the world and objectively analyzing problems. One of the big challenges in this field is that most analyses are only accessible to a select few who have had extensive educational training in statistics and research methods. I became interested in data visualization because it democratizes our understanding of data and research. Visualization can convey results of an analysis more elegantly, with a primary goal of being comprehensible and revealing.
What does “data visualization” mean to you and how has it served your interests and work?
I consider data visualization to be a discipline that draws on both scientific methodology and artistic practice to communicate data and analysis in a way that helps to explore, reveal, and explain. It serves as a powerful tool for quickly and effectively conveying information that would otherwise be obscured by its magnitude and complexity.
Why might a student consider the Master of Science in Data Visualization?
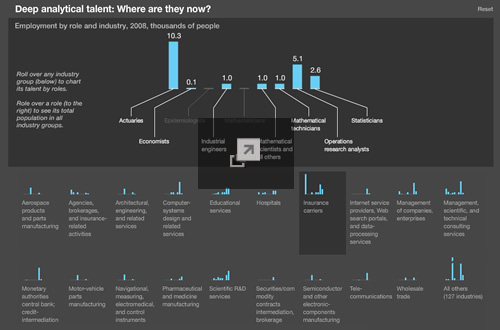
In the late 1960s, American statistician John Tukey envisioned a great future for data visualization where consumers of graphs and charts would have the ability to directly interact with them and make decisions about which data to view and how to view them. But it took a long time for us to develop the computing power to make this vision a reality. We have only recently gained widespread access to affordable cloud-based computing services that make it possible for anyone with a basic laptop to generate very complex and sophisticated work in visualization. We also now have unprecedented amounts of data, from all sectors. Governments and organizations –– in an effort to become more transparent ––are offering direct, open access to troves of interesting data that can help us better understand the world. The world is in need of many more people to help make sense of all these data.
To be effective in data visualization, one must be both an artist and a scientist. Those who are successful in this discipline are adept at:
- Working with and analyzing big, complex, and messy data sets
- Applying the scientific method and following the principles of statistical inference and generalization
- Following the design process and maintaining an artistic practice to create compelling visual representations and interactive experiences
- Exploiting modern web technology to facilitate access to massive, distributed data sets
- Considering the ethical implications of using data to represent people and phenomena
The Master of Science in Data Visualization encompasses all of these areas and considerations, preparing graduates to create work that is both beautiful and scientifically sound.
How can data visualization inform art and design practice?
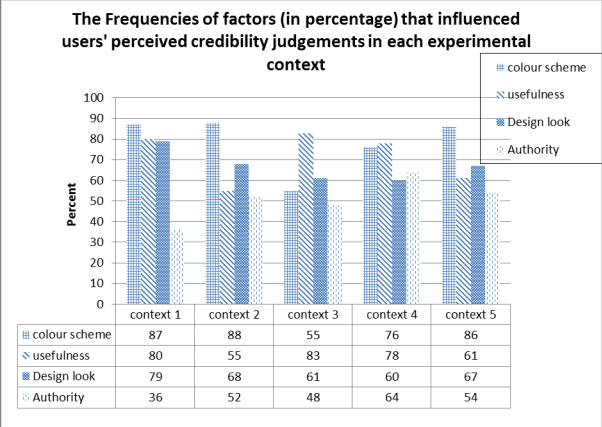
Data visualization has been the domain of the field of statistics since the 18th century but some of the most exciting work in recent years has been coming from artists and designers. The design process leads to better and more sophisticated work. Graphs that are well designed and aesthetically compelling are perceived as being more credible and informative. Good design lends an air of legitimacy to visual representations, which comes with a responsibility to create work that represents data accurately and draws sound and defensible conclusions.
Can you recommend any industry resources, spaces, or events for students interested in finding out more about data visualization ?
New York is a great city for the study and practice of data visualization. It is a major tech hub, with a city government that embraces the Open Data movement, a strong culture of “data for good” across many sectors and professions, and a wealth of organizations who specialize in this area. Professionals meet, gather, and collaborate at conferences, Meetups, hackathons, informal gatherings, and social media (particularly GitHub). It is an open, welcoming community. I recommend going to events in both the arts and sciences, particularly in areas that are outside of one’s comfort zone.
Thank you Aaron!
For more info on Data Visualization, see the interview with Hill’s colleague, Daniel Sauter, Associate Professor of Data Visualization in the School of Art, Media and Technology at Parsons The New School for Design.
…
AARON HILL
Assistant Professor of Data Visualization, Art, Media and Technology
Hill is a Research Associate at MDRC, a nonprofit, nonpartisan organization that develops and evaluates education and social programs that serve the poor. His work at MDRC has focused on labor market retention and advancement for low-wage workers in the United States and the United Kingdom. He specializes in survey design and measurement and analyzes employment characteristics and quality-of-life indicators. He also trains staff in research methods as part of MDRC’s Research Technology Unit. At The New School, Hill teaches graduate courses in statistics. He holds a master’s degree in urban policy and management.