Lev Manovich – Visualizing Instagram data: selfies, cities and protests, March 30th
Posted on November 24, 2015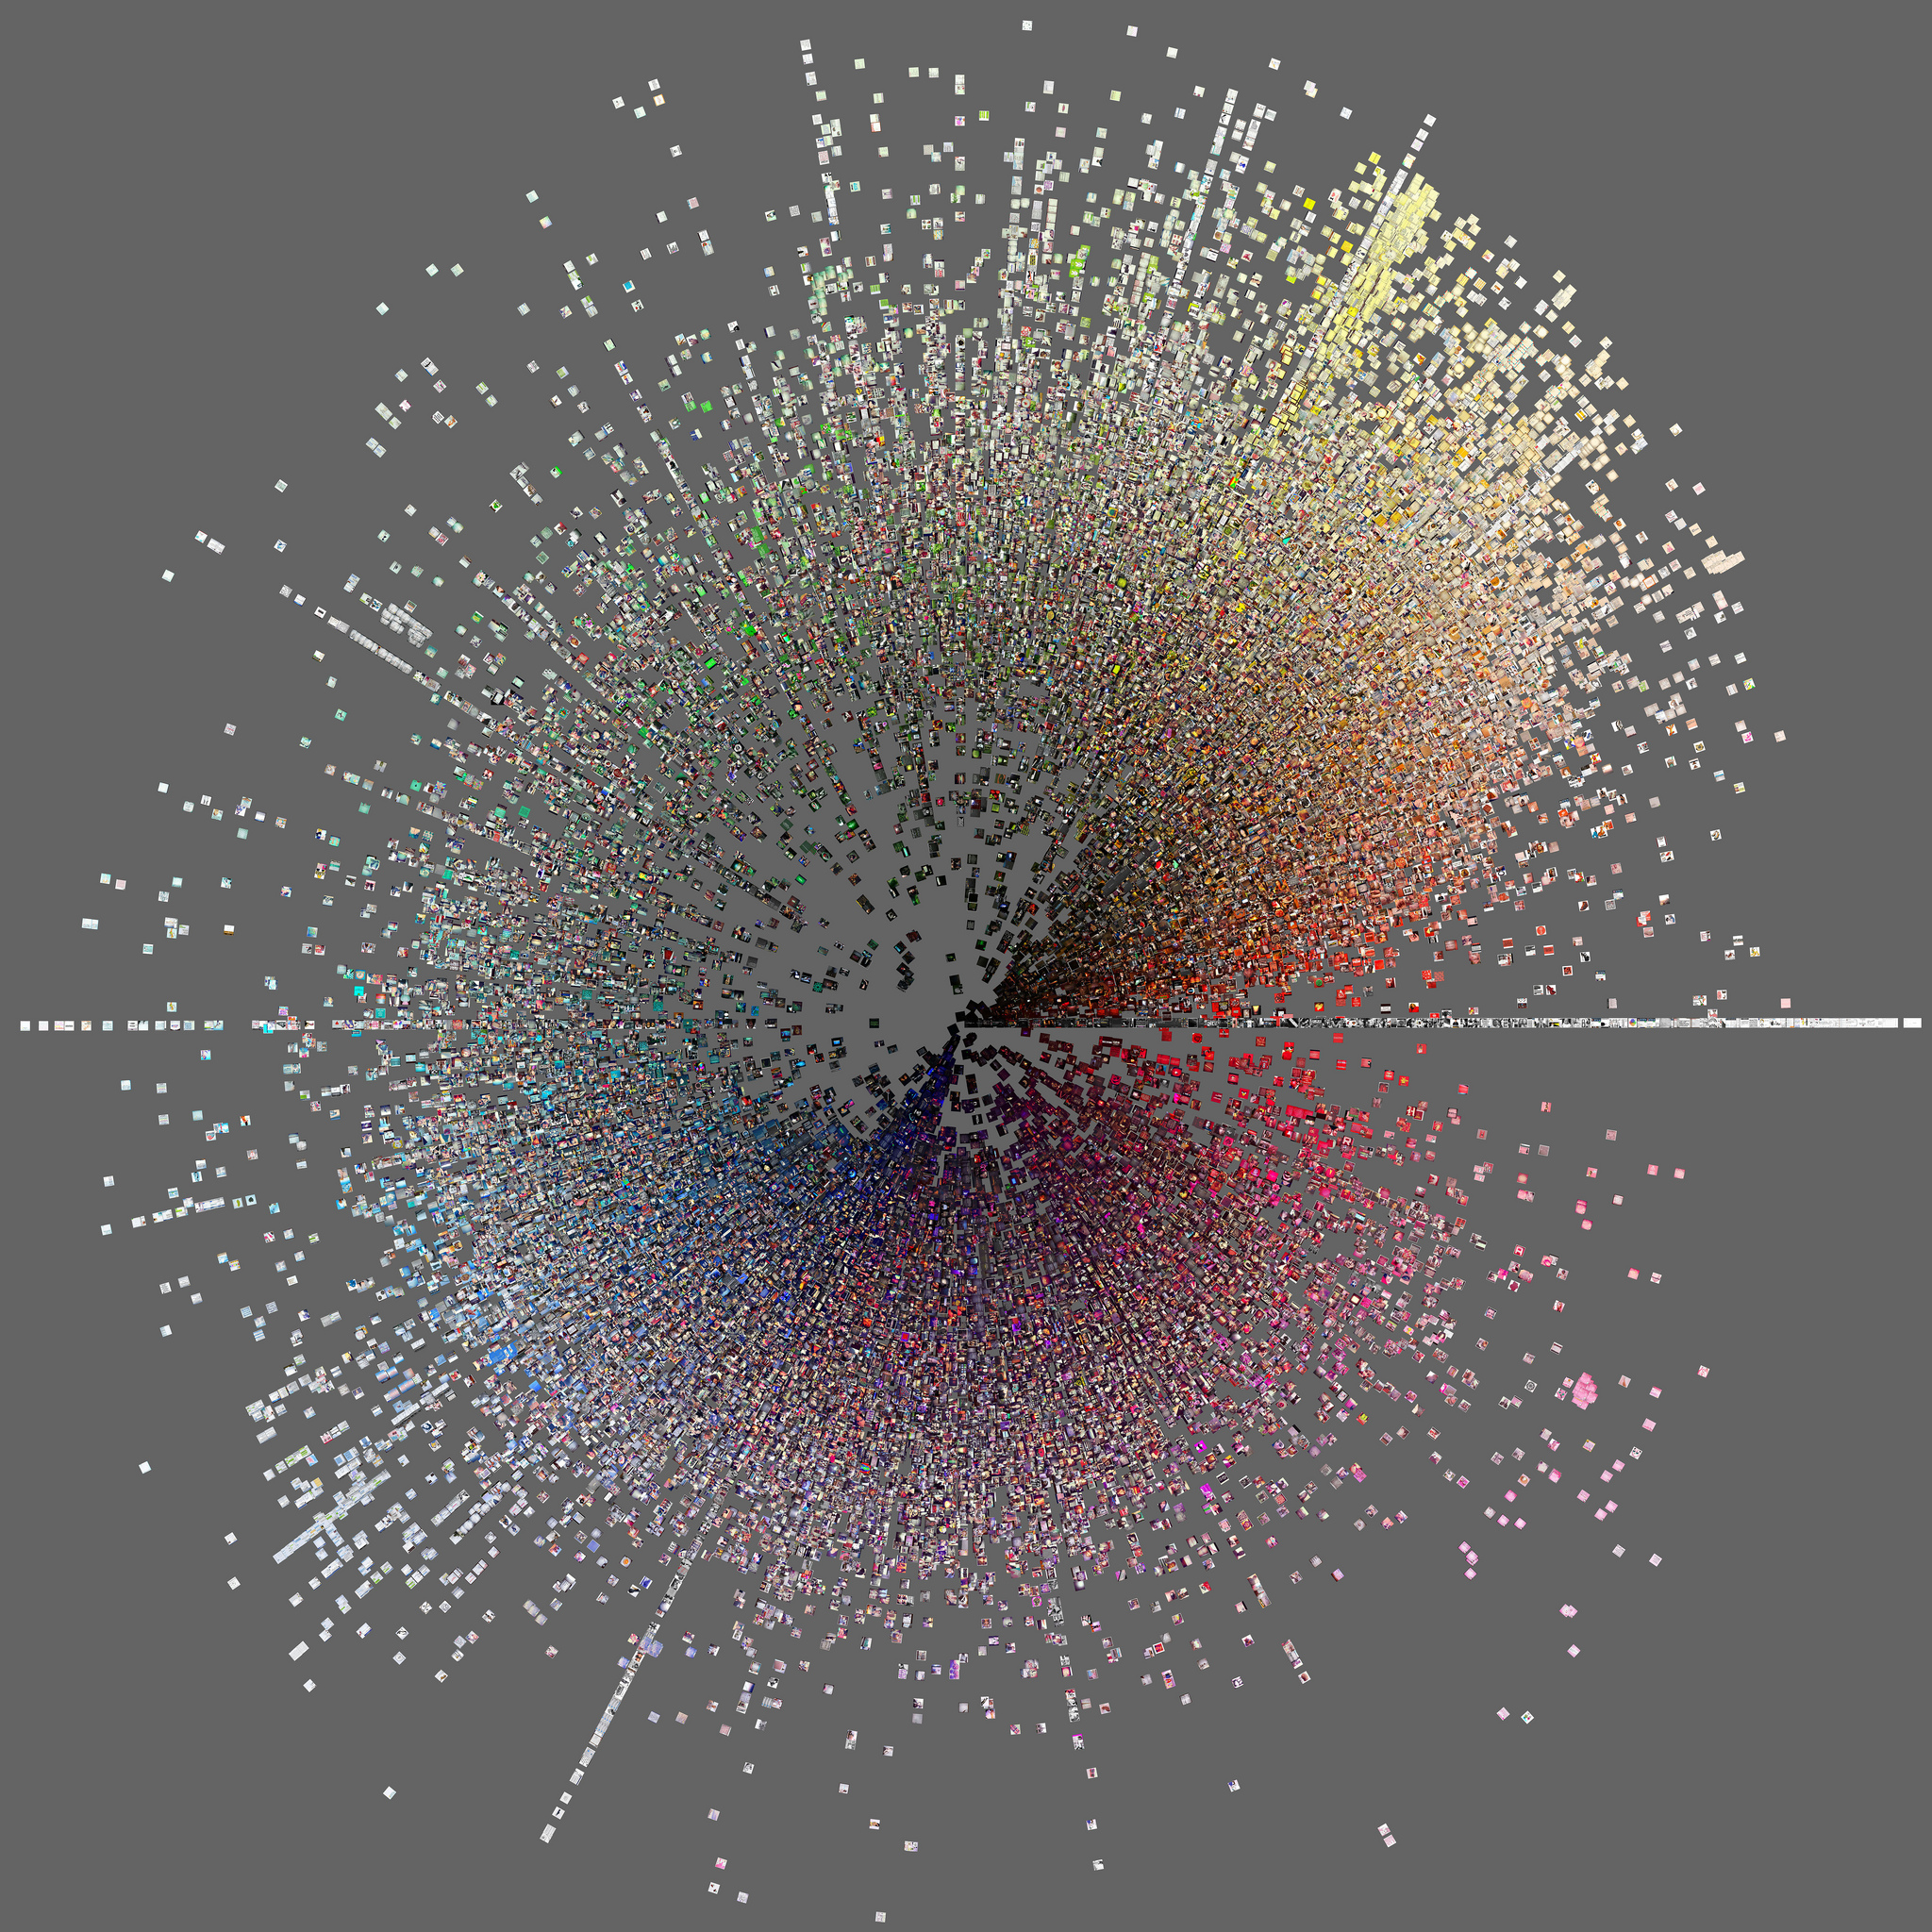
Abstract
How can we explore patterns in massive amounts of visual user-generated content such as billions and images and video on Instagram, Facebook and Twitter? How to democratize data mining so such research can be done by designers, artists and students who don’t have computer science degree? How do we analyze social media data without thinking about “typical,” “popular” or “outliers”? How to use “big data” to question our assumptions about cultures and societies?
In 2007 we have established Software Studies Initiative (softwarestudies.com) to begin working on these questions. I will show a number of projects created in our lab (softwarestudies.com) included recent work created for New York Public Library, MoMA and Google. The projects to be shown include comparison of 2.3 million Instagram images from 13 global cities (phototrails.net), installation exploring Broadway street in NYC using 30 million data points and images (on-broadway.nyc), and analysis of 1 million artworks from the largest network for “user-generated art” (deviantart.com). I will also talk about our current work in progress – analysis of 265 million images shared on Twitter worldwide during 2011-2014.
Description
The explosive growth of social media and cultural content on the web along with the digitization of historical cultural artifacts opened up exiting new possibilities for the analysis of cultural trends, patterns and histories. Today, thousands of researchers have already published papers analyzing massive cultural datasets in many areas including social networks, urban data, online video, web site design fashion photography, popular 20th century music, 19th century literature, etc. While most of this work is done by researchers in computer science, a number of very interesting projects were also created by data designers, media artists, and humanities scholars.
In my lecture I will show a number of projects created in our lab (softwarestudies.com) since 2008. They include comparison of 2.3 million Instagram images from 13 global cities (phototrails.net), interactive installation exploring Broadway street in NYC using 30 million data points and images (onPARSONS Data Visualization Lecture Lev Manovich Visualizing Instagram data: selfies, cities, and protests Wed Feb 3, 2016 6:00pm University Center UL105, on-broadway.nyc), a web tool for comparison of selfie photos from globalcities (selfiecity.net) and analysis of 1 million artworks from the largest network for “user-generated art” (deviantart.com). I will also talk about our current work in progress – analysis of 265 million images shared on Twitter worldwide during 2011-2014.
I will discuss how we combine methods from data science, media art, and design, and how the use of big cultural data helps us question our existing assumptions about culture.
Finally, I will also offer comments about the new emerging “social physics” that uses big data and computation to study the social. Our spontaneous online actions become source of behavioral and cognitive data used for commercial and surveillance purposes – improving results of search engines, customizing recommendations, determining what are the best images to be used in online ads, etc. The science used to focus on nature, with smartest people coming to work in physics, chemistry, astronomy and biology. Today, the social has become the new object of science, with hundreds of thousands of computer scientists, researchers and companies mining and mapping the data about our behaviors. In this way, the humans have become the new “nature” for the sciences. The implications of this grand shift are now beginning to unfold. Will we become the atoms in the “social physics,” first dreamed by the founder of sociology Auguste Comte in the middle of 19th century? Will predictive analytics rule every aspect of our lives? What happens to the society and the individuals when they can rationalize all their communication – the way millions of people already using their Twitter and Facebook analytics to tailor their posts to their audiences?
Bio
Dr. Lev Manovich is the author and editor of eight books including Data Drift (RIXC, 2015), ( Software Takes Command, (Bloomsbury Academic, 2013), Soft Cinema: Navigating the Database (The MIT Press, 2005), and The Language of New Media (The MIT Press, 2001) which was described as “the most suggestive and broad ranging media history since Marshall McLuhan.” Manovich is a Professor of Computer Science at The Graduate Center, CUNY, and a Director of the Software Studies Initiative that works on the analysis and visualization of big cultural data. In 2013 he appeared on the list of “25 People Shaping the Future of Design”. In 2014 he was included in the list of “50 Most Interesting People Building the Future”.