Julia Wargaski’s Information Design Concepts course helps students unearth their capacity to weave complex information design narratives into user-centered solutions. A semester-long deep dive and immersion in relevant information design processes gives students the opportunity to become better problem solvers, collaborators and designers of clear and complex information narratives — skills that transcend medium.
Students get to work on subject matter they are excited about and have the freedom to work within their chosen medium, provided it is in alignment with their intended usersʼ needs. In class, they come together as a group working as one “big brain” to inform and collaborate through feedback cycles around each studentʼs information design investigations.
Below is an excerpt from Julia’s PJIM (Parsons Journal for Information Mapping) article, from November 2014, which sheds light on what she strives for as a teacher and information designer:
“By designing with clarity and integrity, aesthetics and information can be effectively combined to inspire users to rapidly glean knowledge and understanding from complex subjects. By illuminating the functional truths between things, good design can empower others — of any age or origin — to discover solutions and yield the means to tenaciously resolve problems. These beliefs have sparked a shift in my practice within what I call “bedrock knowledge areas,” and the communication systems to convey and publish these. As an educator, my goals are continually set on discovering and stretching each studentʼs highest abilities: adaptability, visual and intellectual acuity, design adeptness, and tenacity. I strive to provide an environment where choice and experimentation, through visualization modeling, will be the catalyst for these qualities to arise and be fulfilled.”

Female Infanticide in India, Purwa Chan — Copyright Purwa Chauhan, Information Design 2 independent study. The many female infanticide cases as well as sex selective abortions are a significant hindering social phenomenon in several parts of India. This phenomenon exceeds caste, class and community as well as the North and South divide of the country. The girl child is many a time a target of attack before she is even born. The sex ratio of India is in favor of boys and continues to further widen over the years. There might come a stage when it might be impossible to make up for the missing girls leading to the complete breakdown of the Indian social and human fabric as we know of it now. In this interactive information graphic users would help users make word map associations to themes and topics relating to this social phenomenon and find out the underlying causes.
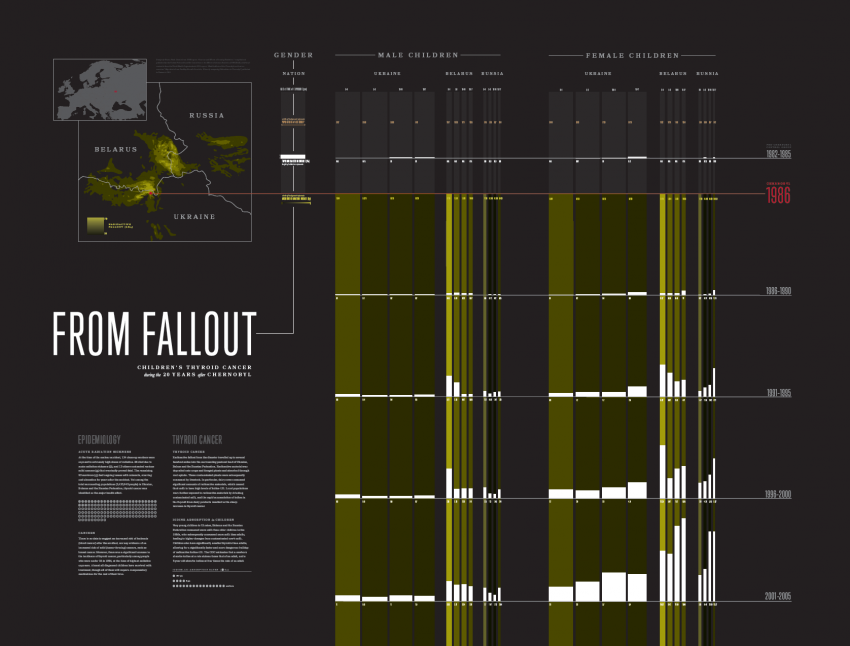
From Fallout: Childrenʼs Thyroid Cancer during the 20 Years after Chernobyl, Emma Funk — Copyright Emma Funk. This poster maps the epidemiological effects (specifically thyroid cancer among children, as that is the major health effect determined by the UN) of the nuclear disaster at Chernobyl. It tracks thyroid cancer incidence at regular time intervals from 1982 (to give a control value pre-1986) to 2005 and depicts incidence in relation to radiation dosage (as it wouldʼve been absorbed by the thyroid, measured in Gy), age at time of exposure (separated into four age groups), gender, and the population of each age group. It also provides context for how radioactivity relates to thyroid cancer (the process of human ingestion of radioactive Iodine 131), geographic context for where radioactive fallout spread from the Chernobyl power plant into Ukraine, Belarus and Russia, and generally speaks to scientific suppositions about the causes behind the trends shown by the data.
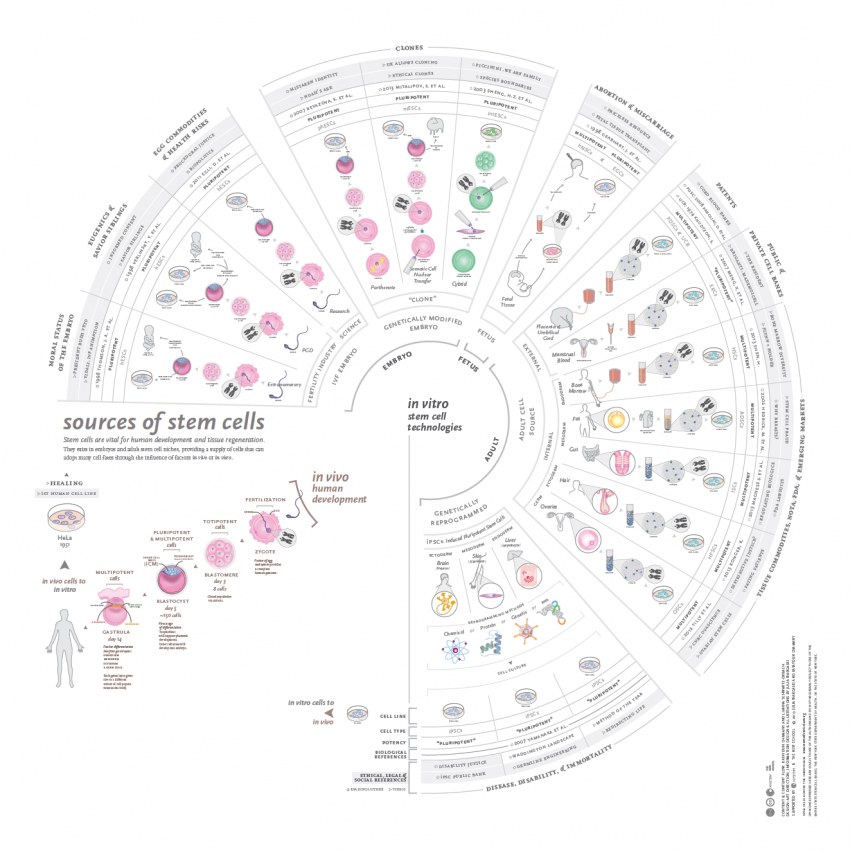
Sources of Stem Cells, Julia Wargaski I collaborated with Katayoun Chamany and Lianna Schwartz-Orbach, two biologists/content and content flow creators, to co-create the Sources of Stem Cells Radial Infographic and twelve related ZoomGraphics (Detailed Sheets). I transformed biotechnological processes associated with stem cell research into intuitive information design narratives that highlight the provenance, manipulation, and use of each stem cell type and its associated therapeutic and scientific potential — information design as educational tools.
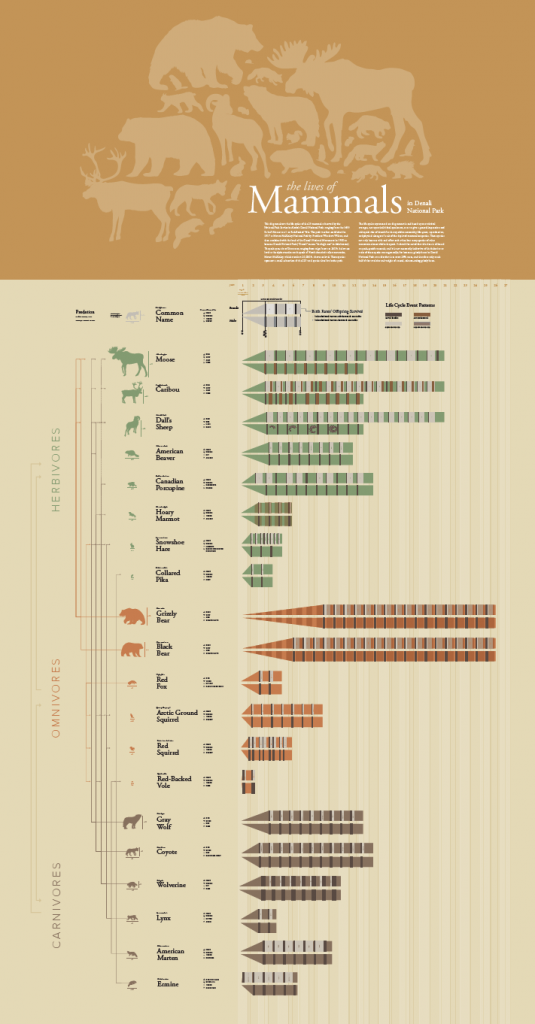
The Lives of Mammals in Denali National Park, Emma Funk — Copyright Emma Funk. This diagram charts the life cycles of the 20 mammals observed by the National Park Service in Alaskaʼs Denali National Park, ranging from the 1600 lb. bull Moose to a 1 oz Red-Backed Vole. The park was first established in 1917 as Mount McKinley National Park by President Woodrow Wilson, and then combined with the land of the Denali National Monument in 1980 to become Denali National Park (“Denali” means “the high one” in Athabascan). The park spans six million acres, ranging from taiga forests at 240 ft. below sea level to the alpine tundra on the peak of North Americaʼs tallest mountain, Mount McKinley, which stands at 20,230 ft. above sea level. These species represent a small subsection of the 223 total species that live in the park. The life cycles represented are diagrammatic and based upon statistical averages, not upon individual specimens, so as to give a general impression and colloquial rule of thumb for the repetitive seasonality, life spans, reproduction, and physical changes of each of the depicted mammalian species. These species not only interact with and affect each other, but many species of other taxonomic classes within the park. It should be noted that this data is all based on park-specific research, and it is not necessarily indicative of the behavior or traits of these species more generally; for instance, grizzly bears in Denali National Park eat a diet that is at most 20% meat, and therefore only reach half of the total size and weight of coastal, salmon-eating grizzly bears.